Visualising Opportunity Solution Trees in Mermaid

Feb 27, 2025

An Oppportunity Solution Tree help visualise your thinking, focus on outcomes rather than solutions, and ultimately make better product decisions.

There are many ways to capture and visualise them, from general purpose diagramming tools like Miro, through to purpose built like Vistaly. And while both of these (and many others) do an excellent job, building diagrams as code is appealing to me as it means that:

  • layout is handled outside of the semantic structure of the diagram, so changes don’t require a manual reshuffle of nodes in the tree
  • the diagram is accessible in a text format, not locked into a propriatary format
  • because it is plain text, I can track changes with version control
  • if required, I could programatically build the diagram

Of course, I’m sure there are tools that auto-layout graphs, and most platforms will have APIs for programatically creating diagrams, but I’m easily distracted into a good yak shaving session, so here we are.

Mermaid is a fantastic tool that converts text structured according to a simple DSL into a wide range of diagrams. Mermaid charts and diagrams are also natively supported in Github and Obsidian (amongst many others), so it’s a valuable tool to have at your disposal.

I really like the clean styling of this tree so I’d like to recreate that using Mermaid.

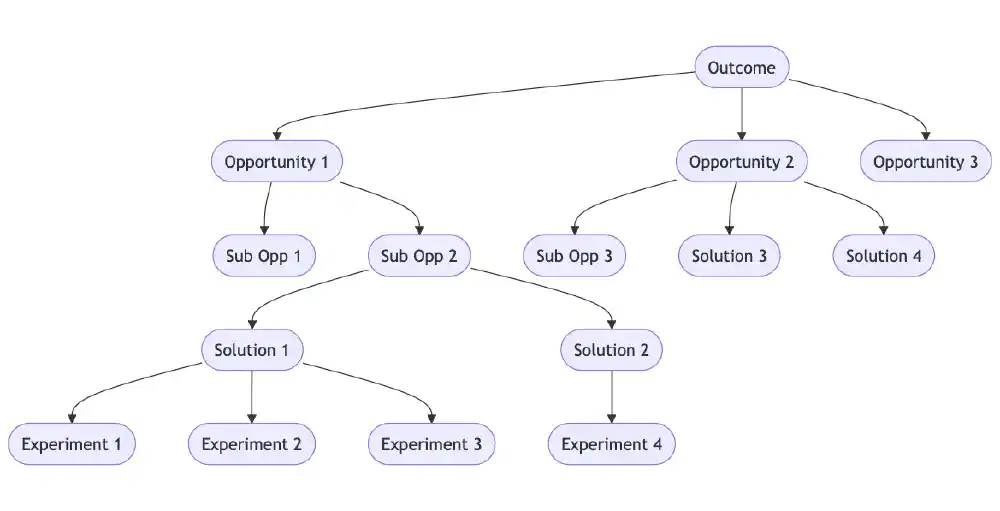
To begin with, I built a basic outline structure of a single outcome, some opportunities and sub-opportunities, solutions, and experiments.

 1
 2
 3
 4
 5
 6
 7
 8
 9
10
11
12
13
14
15
16
17
18
19
20
21
22
23
24
25
26
27
28
29
30
31
32
33
34
35
graph TD
%%   Create outcome
  out([Outcome])
%%   Create opportunities and link to outcome
  opp1([Opportunity 1])
  opp2([Opportunity 2])
  opp3([Opportunity 3])
  out --> opp1
  out --> opp2
  out --> opp3
%%   Create sub-opportunities and link to opportunities
  sopp1([Sub Opp 1])
  sopp2([Sub Opp 2])
  sopp3([Sub Opp 3])
  opp1 --> sopp1
  opp1 --> sopp2
  opp2 --> sopp3
%%   Create solutions and link to opportunities and sub-Opportunities
  sol1([Solution 1])
  sol2([Solution 2])
  sol3([Solution 3])
  sol4([Solution 4])
  sopp2 --> sol1
  sopp2 --> sol2
  opp2 --> sol3
  opp2 --> sol4
%%   Create experiments and link to solutions
  t1([Experiment 1])
  t2([Experiment 2])
  t3([Experiment 3])
  t4([Experiment 4])
  sol1 --> t1
  sol1 --> t2
  sol1 --> t3
  sol2 --> t4

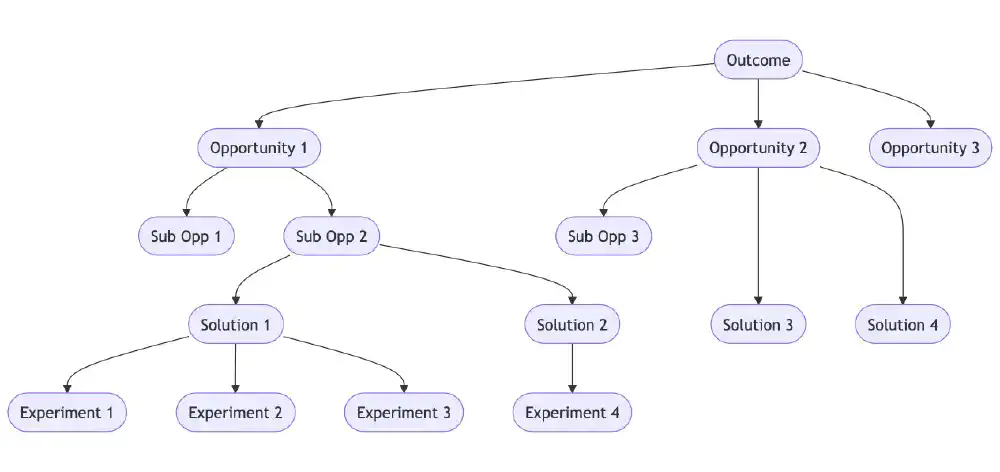
We’ll get to the styling in a bit, but the obvious problem is that on the right hand side of the image, Solution 3 and Solution 4 are on the same level as the sub-opportunities. Mermaid support extending a connector by just adding another -:

24
25
26
27
28
29
  sopp2 --> sol1
  sopp2 --> sol2
  opp2 ---> sol3
  opp2 ---> sol4
%%   Create experiments and link to solutions
  t1([Experiment 1])

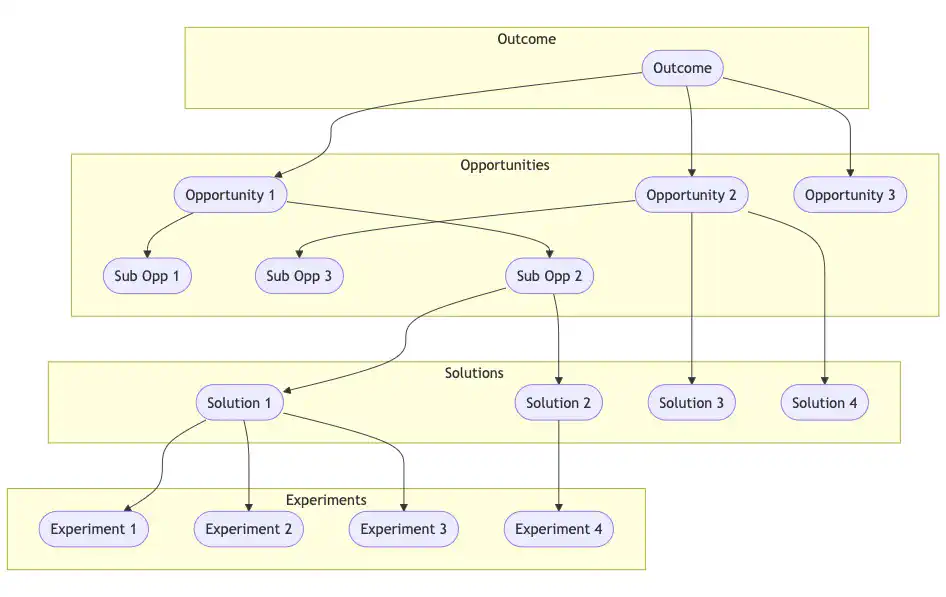
I had also previously tried by keeping all of the opportunities, solutions and experiments in their own sub-graphs (and forcing them into order using invisible connectors), but I wasn’t a fan of the connecting line style, and (as far as I can tell) you cannot remove the sub-graph labels.

 1
 2
 3
 4
 5
 6
 7
 8
 9
10
11
12
13
14
15
16
17
18
19
20
21
22
23
24
25
26
27
28
29
30
31
32
33
34
35
36
37
38
39
40
41
42
graph TD
  subgraph outcome ["Outcome"]
  out([Outcome])
  end

  subgraph opp ["Opportunities"]
  opp1([Opportunity 1])
  opp2([Opportunity 2])
  opp3([Opportunity 3])
  out --> opp1
  out --> opp2
  out --> opp3
  sopp1([Sub Opp 1])
  sopp2([Sub Opp 2])
  sopp3([Sub Opp 3])
  opp1 --> sopp1
  opp1 --> sopp2
  opp2 --> sopp3
  end

  subgraph solution ["Solutions"]
  sol1([Solution 1])
  sol2([Solution 2])
  sol3([Solution 3])
  sol4([Solution 4])
  sopp2 --> sol1
  sopp2 --> sol2
  opp2 --> sol3
  opp2 --> sol4
  end
  subgraph experiment ["Experiments"]
  t1([Experiment 1])
  t2([Experiment 2])
  t3([Experiment 3])
  t4([Experiment 4])
  sol1 --> t1
  sol1 --> t2
  sol1 --> t3
  sol2 --> t4
  end

  outcome ~~~ opp ~~~ solution ~~~ experiment

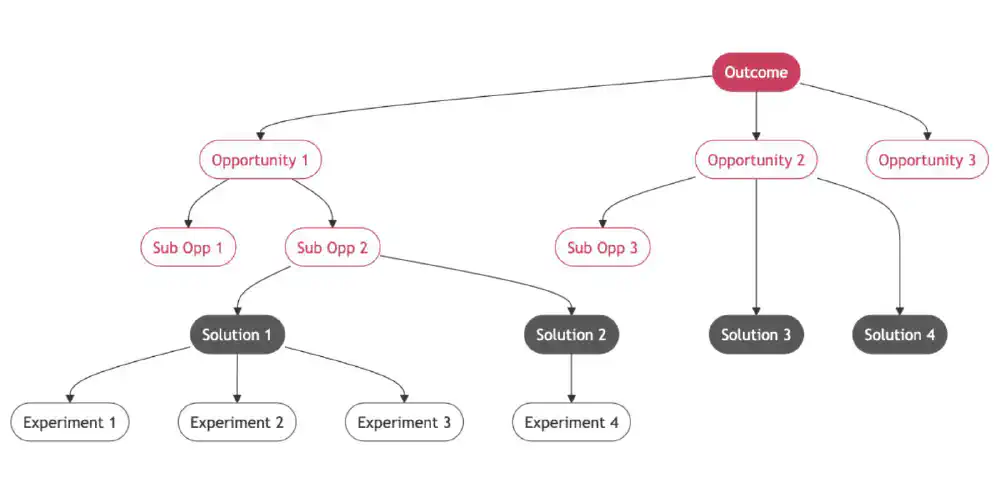
Mermaid also supports creating style classes, and applying those classed to the nodes in the tree. This creates individual classes for the four types of nodes in my tree:

classDef outcome fill:#C83F5E,color:#fff,stroke:#C83F5E
classDef opp fill:#fff,stroke:#C83F5E,color:#C83F5E
classDef sol fill:#585858,stroke:#585858,color:#fff
classDef exp fill:#fff,stroke:#585858

You can then apply the class by appending ::: and the class name to the node:

 1
 2
 3
 4
 5
 6
 7
 8
 9
10
11
12
13
14
15
16
17
18
19
20
21
22
23
24
25
26
27
28
29
30
31
32
33
34
35
36
37
38
39
graph TD
%%   Create outcome
  out([Outcome]):::outcome
%%   Create opportunities and link to outcome
  opp1([Opportunity 1]):::opp
  opp2([Opportunity 2]):::opp
  opp3([Opportunity 3]):::opp
  out --> opp1
  out --> opp2
  out --> opp3
%%   Create sub-opportunities and link to opportunities
  sopp1([Sub Opp 1]):::opp
  sopp2([Sub Opp 2]):::opp
  sopp3([Sub Opp 3]):::opp
  opp1 --> sopp1
  opp1 --> sopp2
  opp2 --> sopp3
%%   Create solutions and link to opportunities and sub-Opportunities
  sol1([Solution 1]):::sol
  sol2([Solution 2]):::sol
  sol3([Solution 3]):::sol
  sol4([Solution 4]):::sol
  sopp2 --> sol1
  sopp2 --> sol2
  opp2 ---> sol3
  opp2 ---> sol4
%%   Create experiments and link to solutions
  t1([Experiment 1]):::exp
  t2([Experiment 2]):::exp
  t3([Experiment 3]):::exp
  t4([Experiment 4]):::exp
  sol1 --> t1
  sol1 --> t2
  sol1 --> t3
  sol2 --> t4
classDef outcome fill:#C83F5E,color:#fff,stroke:#C83F5E
classDef opp fill:#fff,stroke:#C83F5E,color:#C83F5E
classDef sol fill:#585858,stroke:#585858,color:#fff
classDef exp fill:#fff,stroke:#585858

This isn’t going to be the most convenient way to rapidly build a tree, and it remains to be seen how well it holds up with complex trees where a single solution might fulfil multiple opportunities. I am however interested to see if these can be programatically built from existing data sources (like Jira Product Discovery).